Total Knee Arthroplasty · Landmark Localisation
SurfMark3D: Surface-Based Graph Convolution for Distal Femoral Landmark Localisation
Healthcare Technology Innovation Centre, IIT Madras, India · * Equal contribution † Corresponding author
ABSTRACT
Accurate localisation of anatomical landmarks on the distal femur is a critical prerequisite for surgical planning in image-based Total Knee Arthroplasty (TKA). Manual annotation is time-consuming and prone to variability, which can lead to inconsistent implant sizing. Existing classical and deep learning methods remain limited by latency, computational cost, and modality dependence. We operate on segmented 3D surface point clouds and formulate distal femoral landmark localisation as a heatmap regression task that predicts dense probability fields, with ground-truth heatmaps constructed as Euclidean Gaussians using learnable landmark-specific sigmas. We introduce a hybrid graph-convolution backbone that combines Low-Rank Adaptive Graph Convolution (LR-AGConv) for local feature extraction and Bi-level Routing Point Attention (BRPA) for efficient global semantic modelling. The network is trained using Adaptive Wing loss and PointSTAR — a novel point-cloud adaptation of Self-adaptive Ambiguity Reduction (STAR) loss — with uncertainty-based multi-task weighting. We curate and release a clinically validated dataset of 550 distal femurs derived from the ShapeMed Knee study with expert landmark annotations. The proposed method consistently outperforms state-of-the-art baselines, achieving a Mean Euclidean Error of 1.24 ± 0.84 mm across all 11 anatomical landmarks.
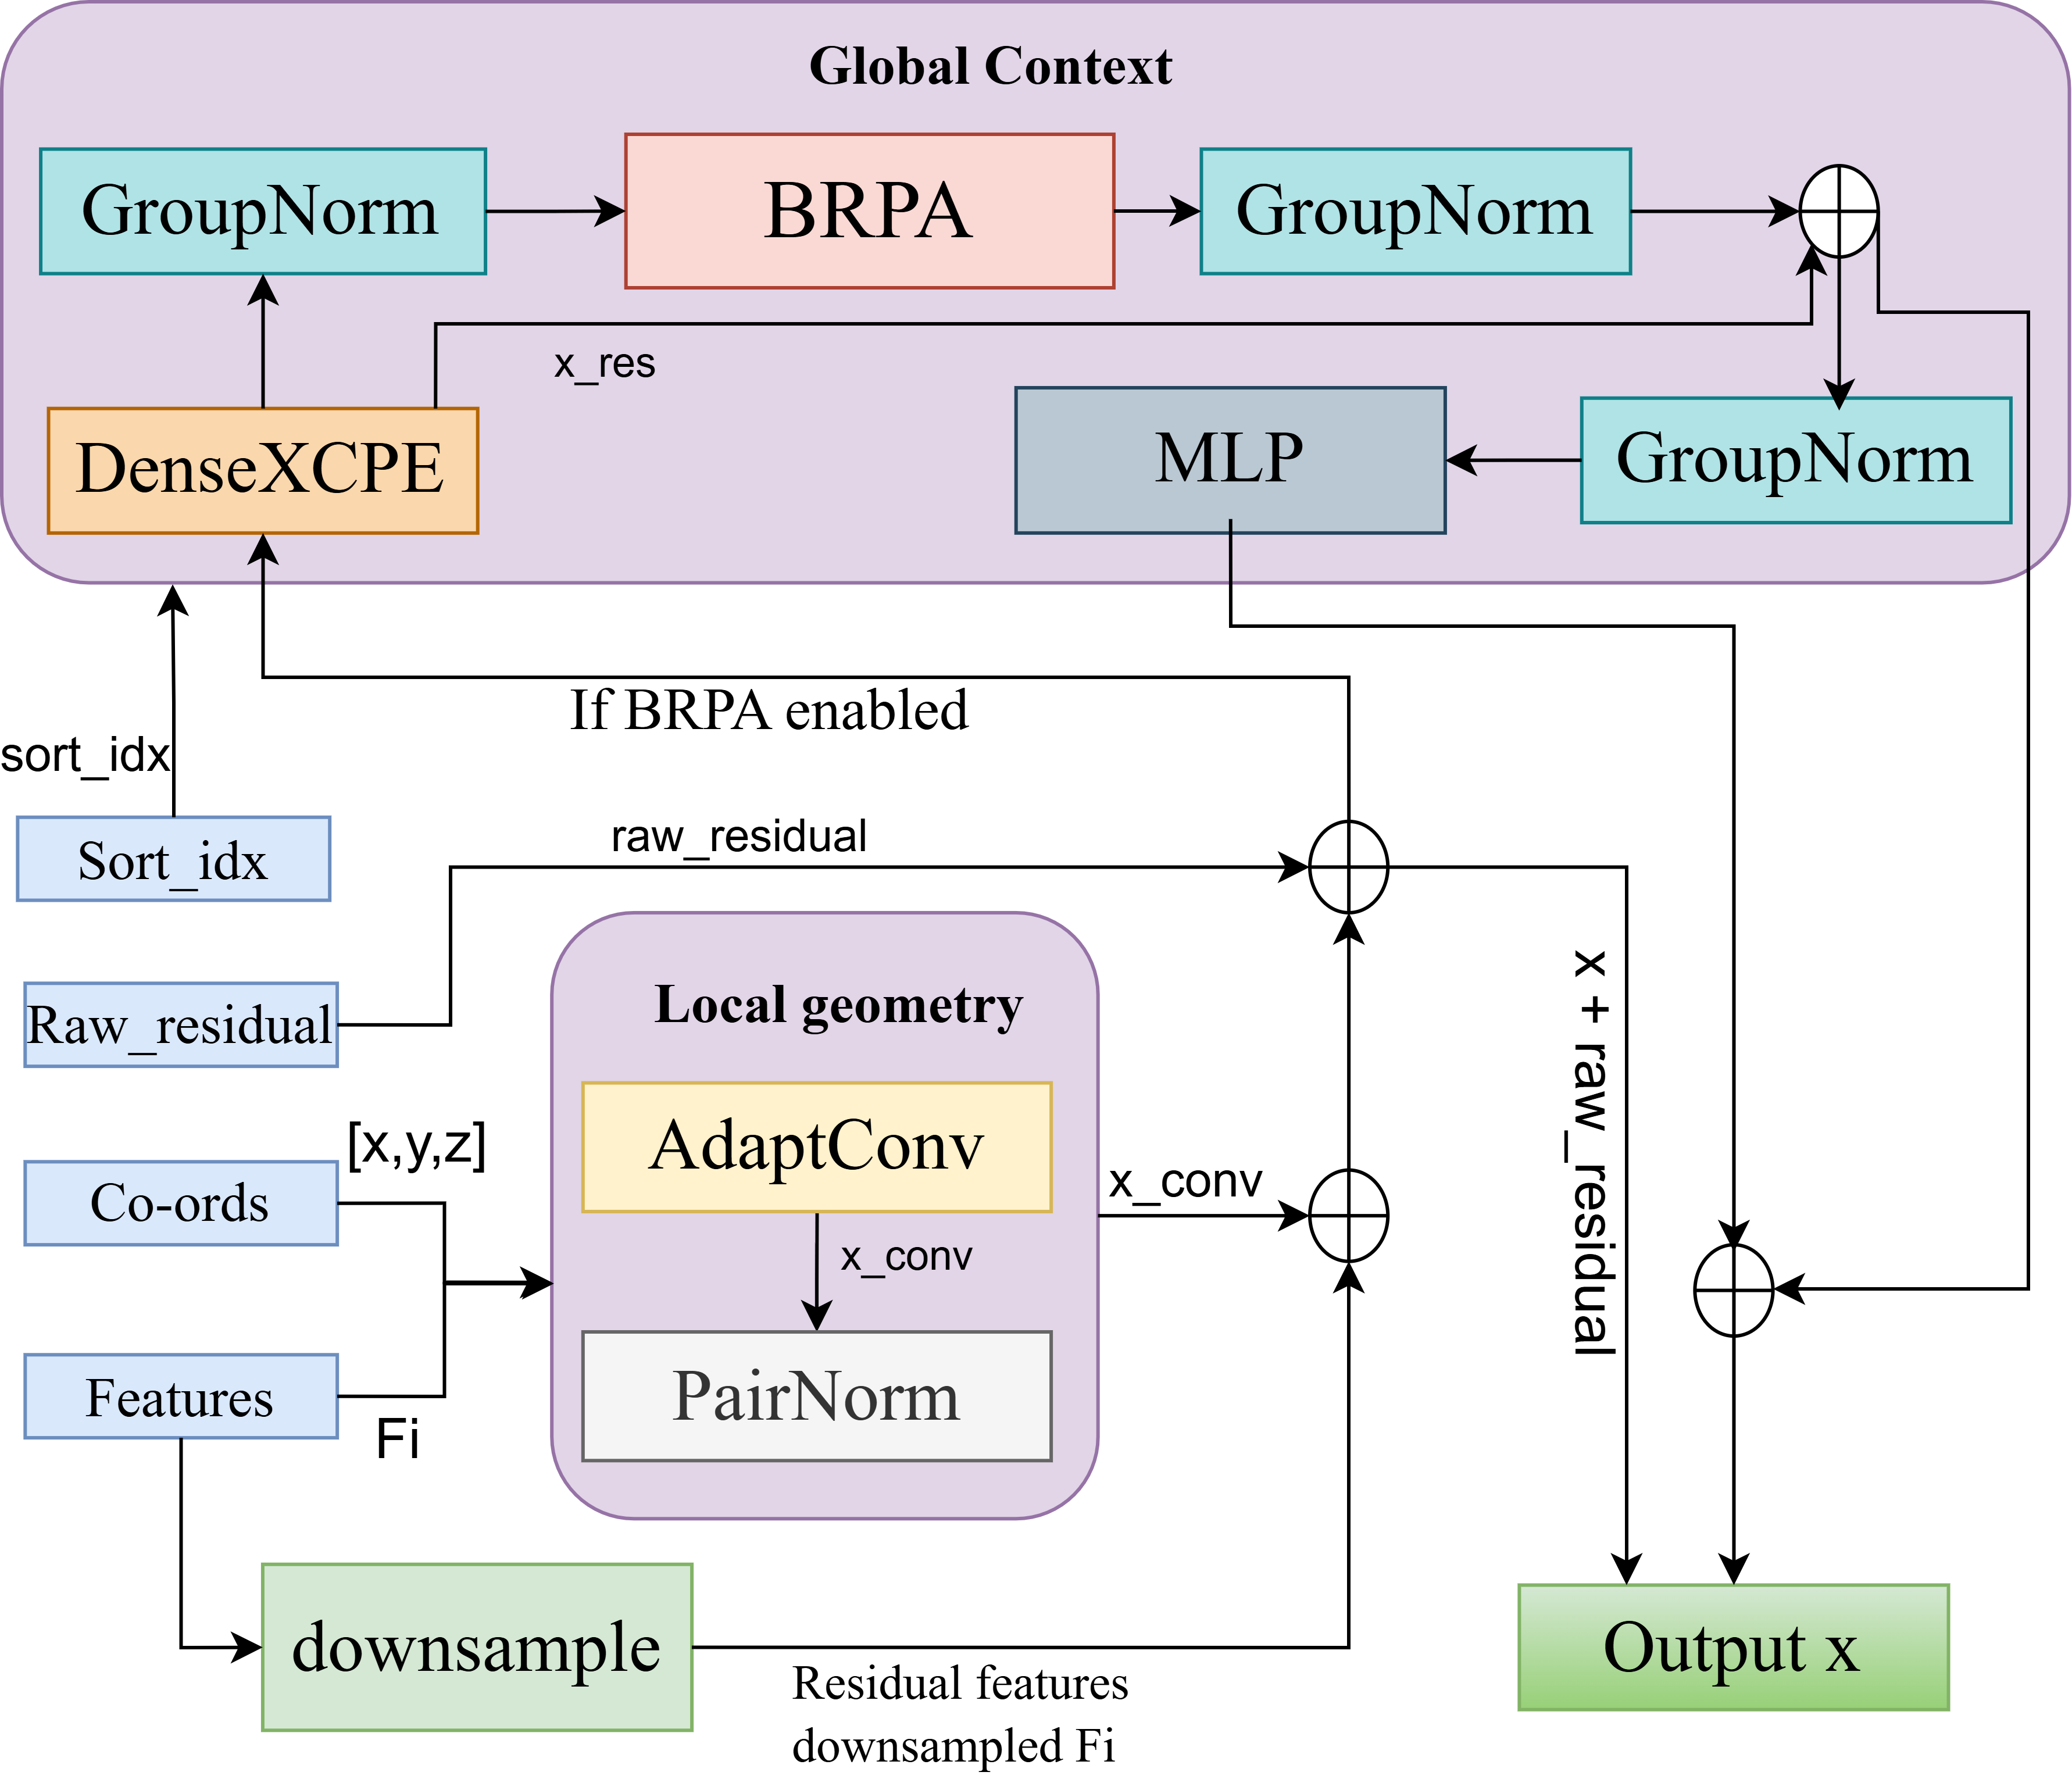
A hybrid block for local geometry and global context
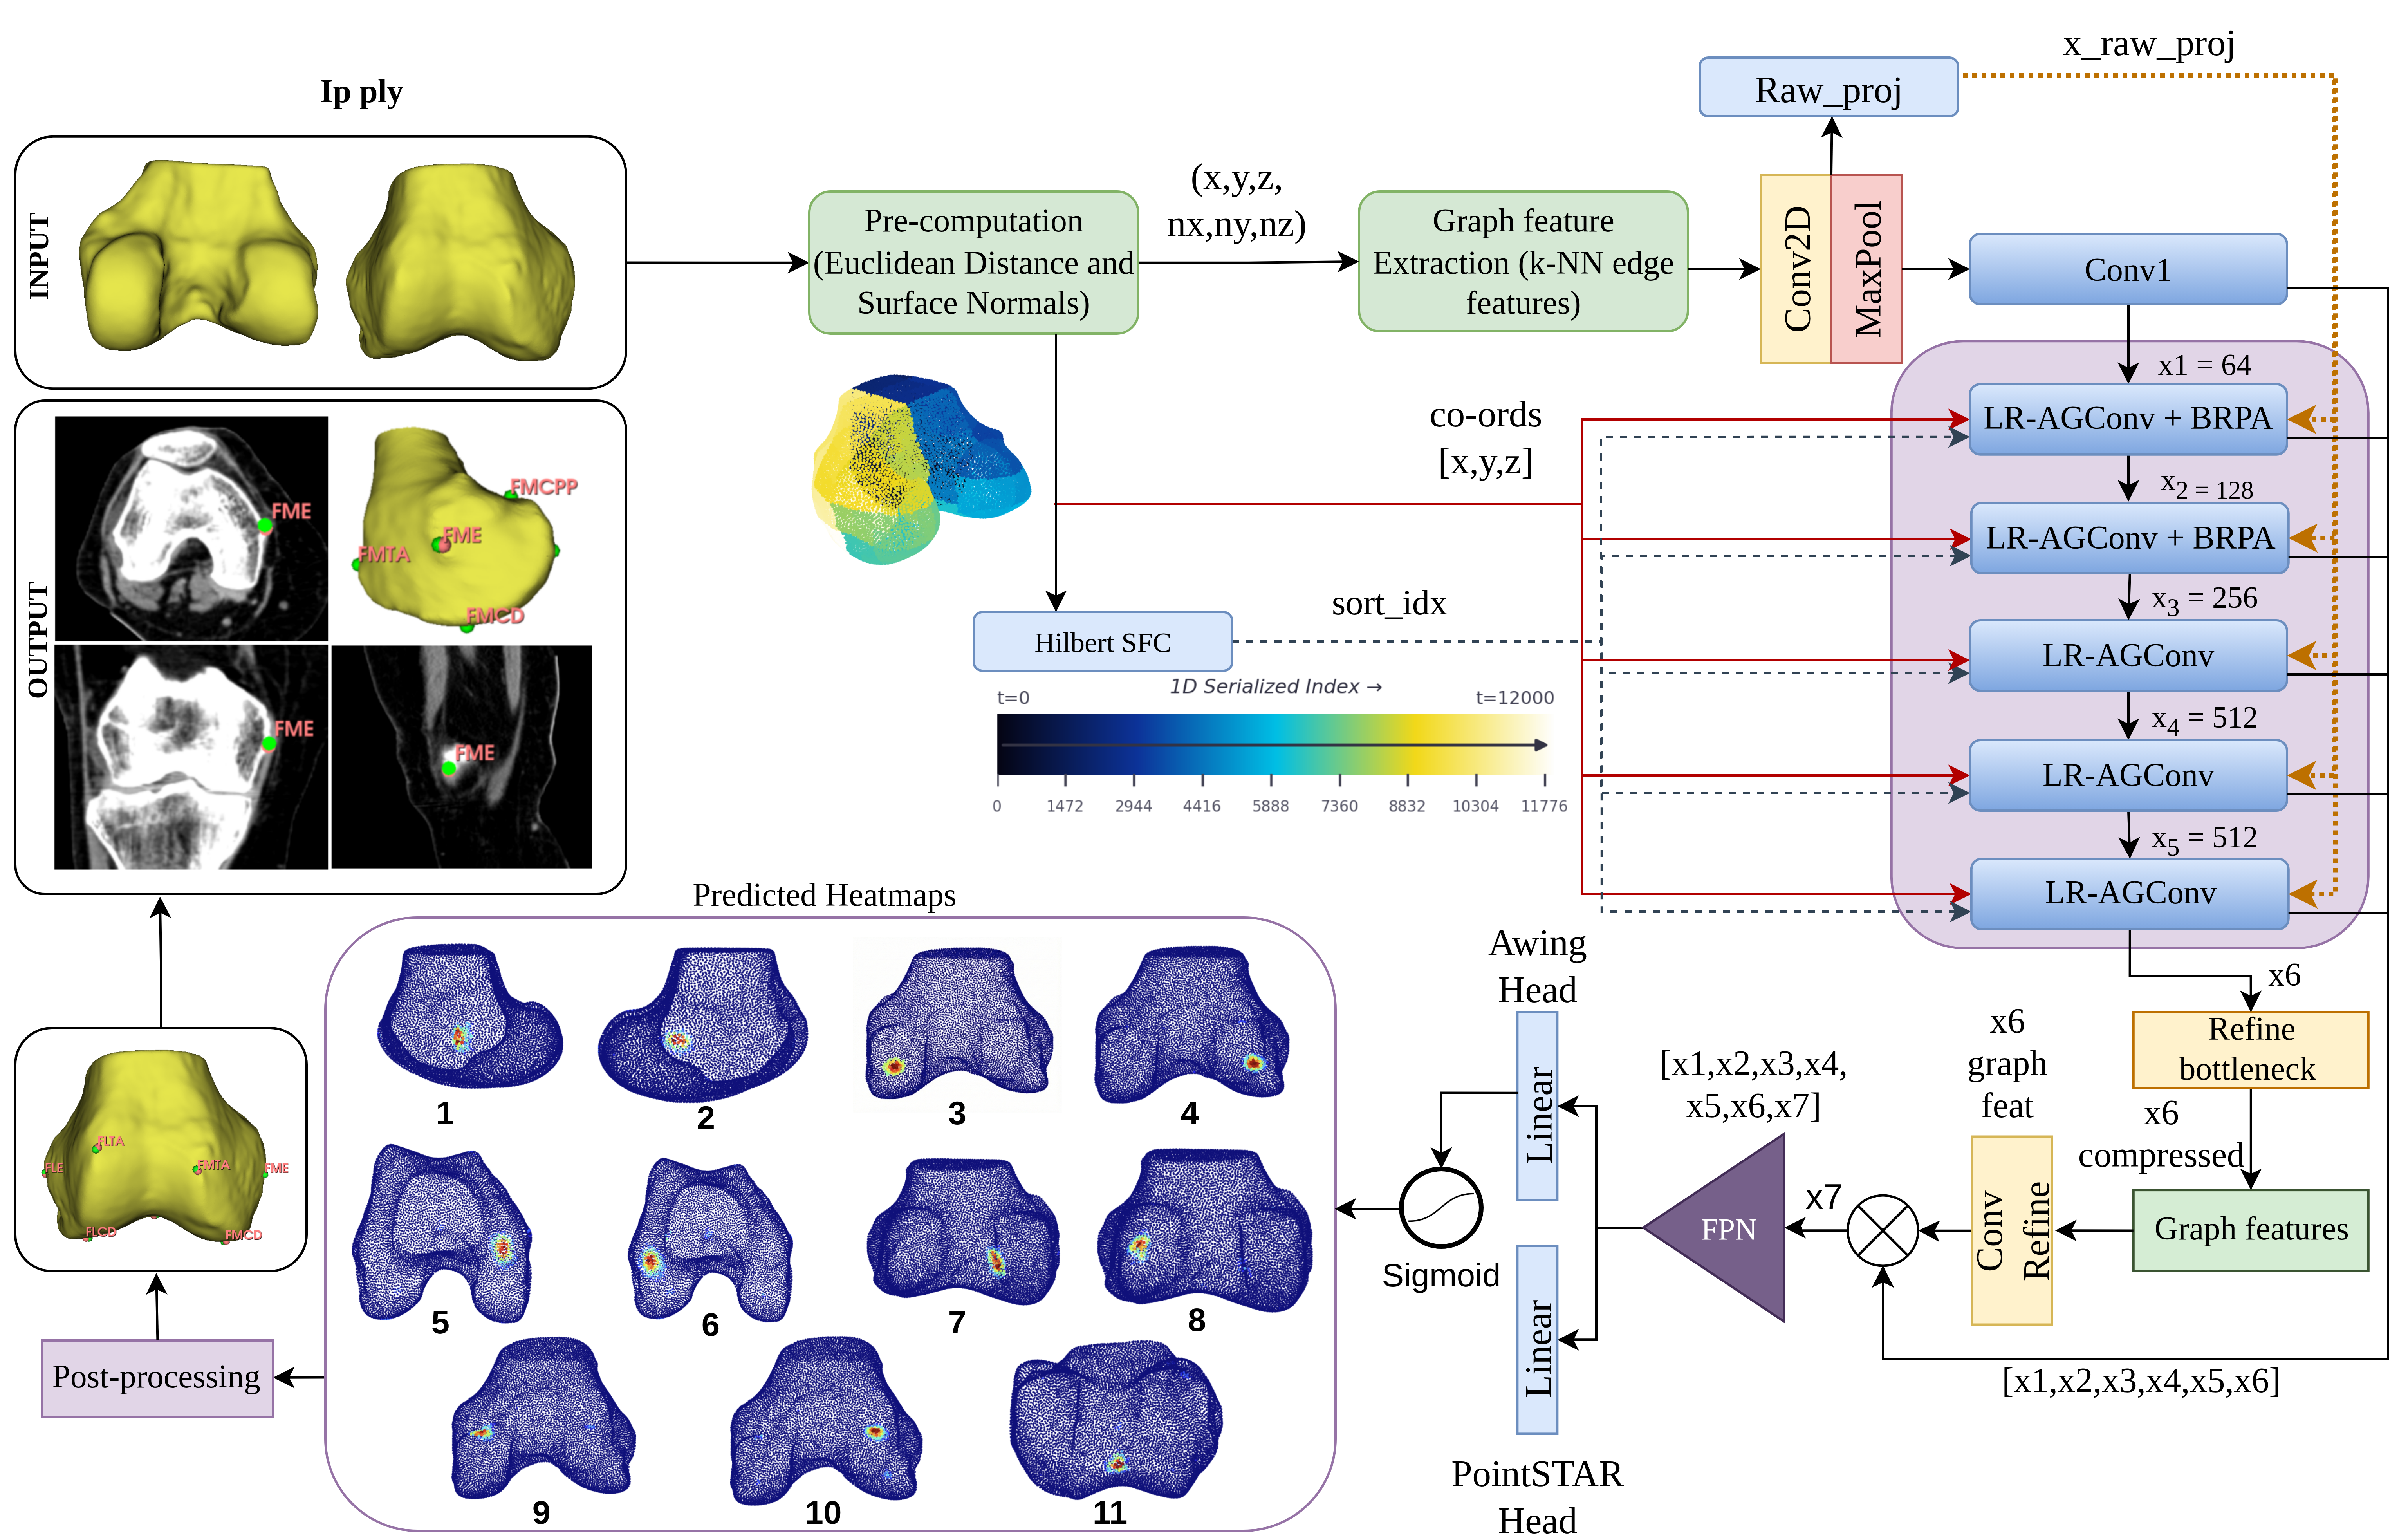
The six-layer backbone keeps full spatial resolution throughout. Stages 1–3 run the hybrid block below, pairing local graph convolution with routed global attention; stages 4–6 use LR-AGConv alone, isolating the fine surface detail that precise localisation depends on.
What each Components is doing
Input features are compressed through a linear bottleneck before dynamic, low-rank kernels are synthesised per edge from the local feature graph. Aggregating in this reduced space avoids materialising large intermediate tensors, cutting peak training memory by 43.1% (40.4 GB → 23.0 GB) versus dense AGConv, without a drop in accuracy.
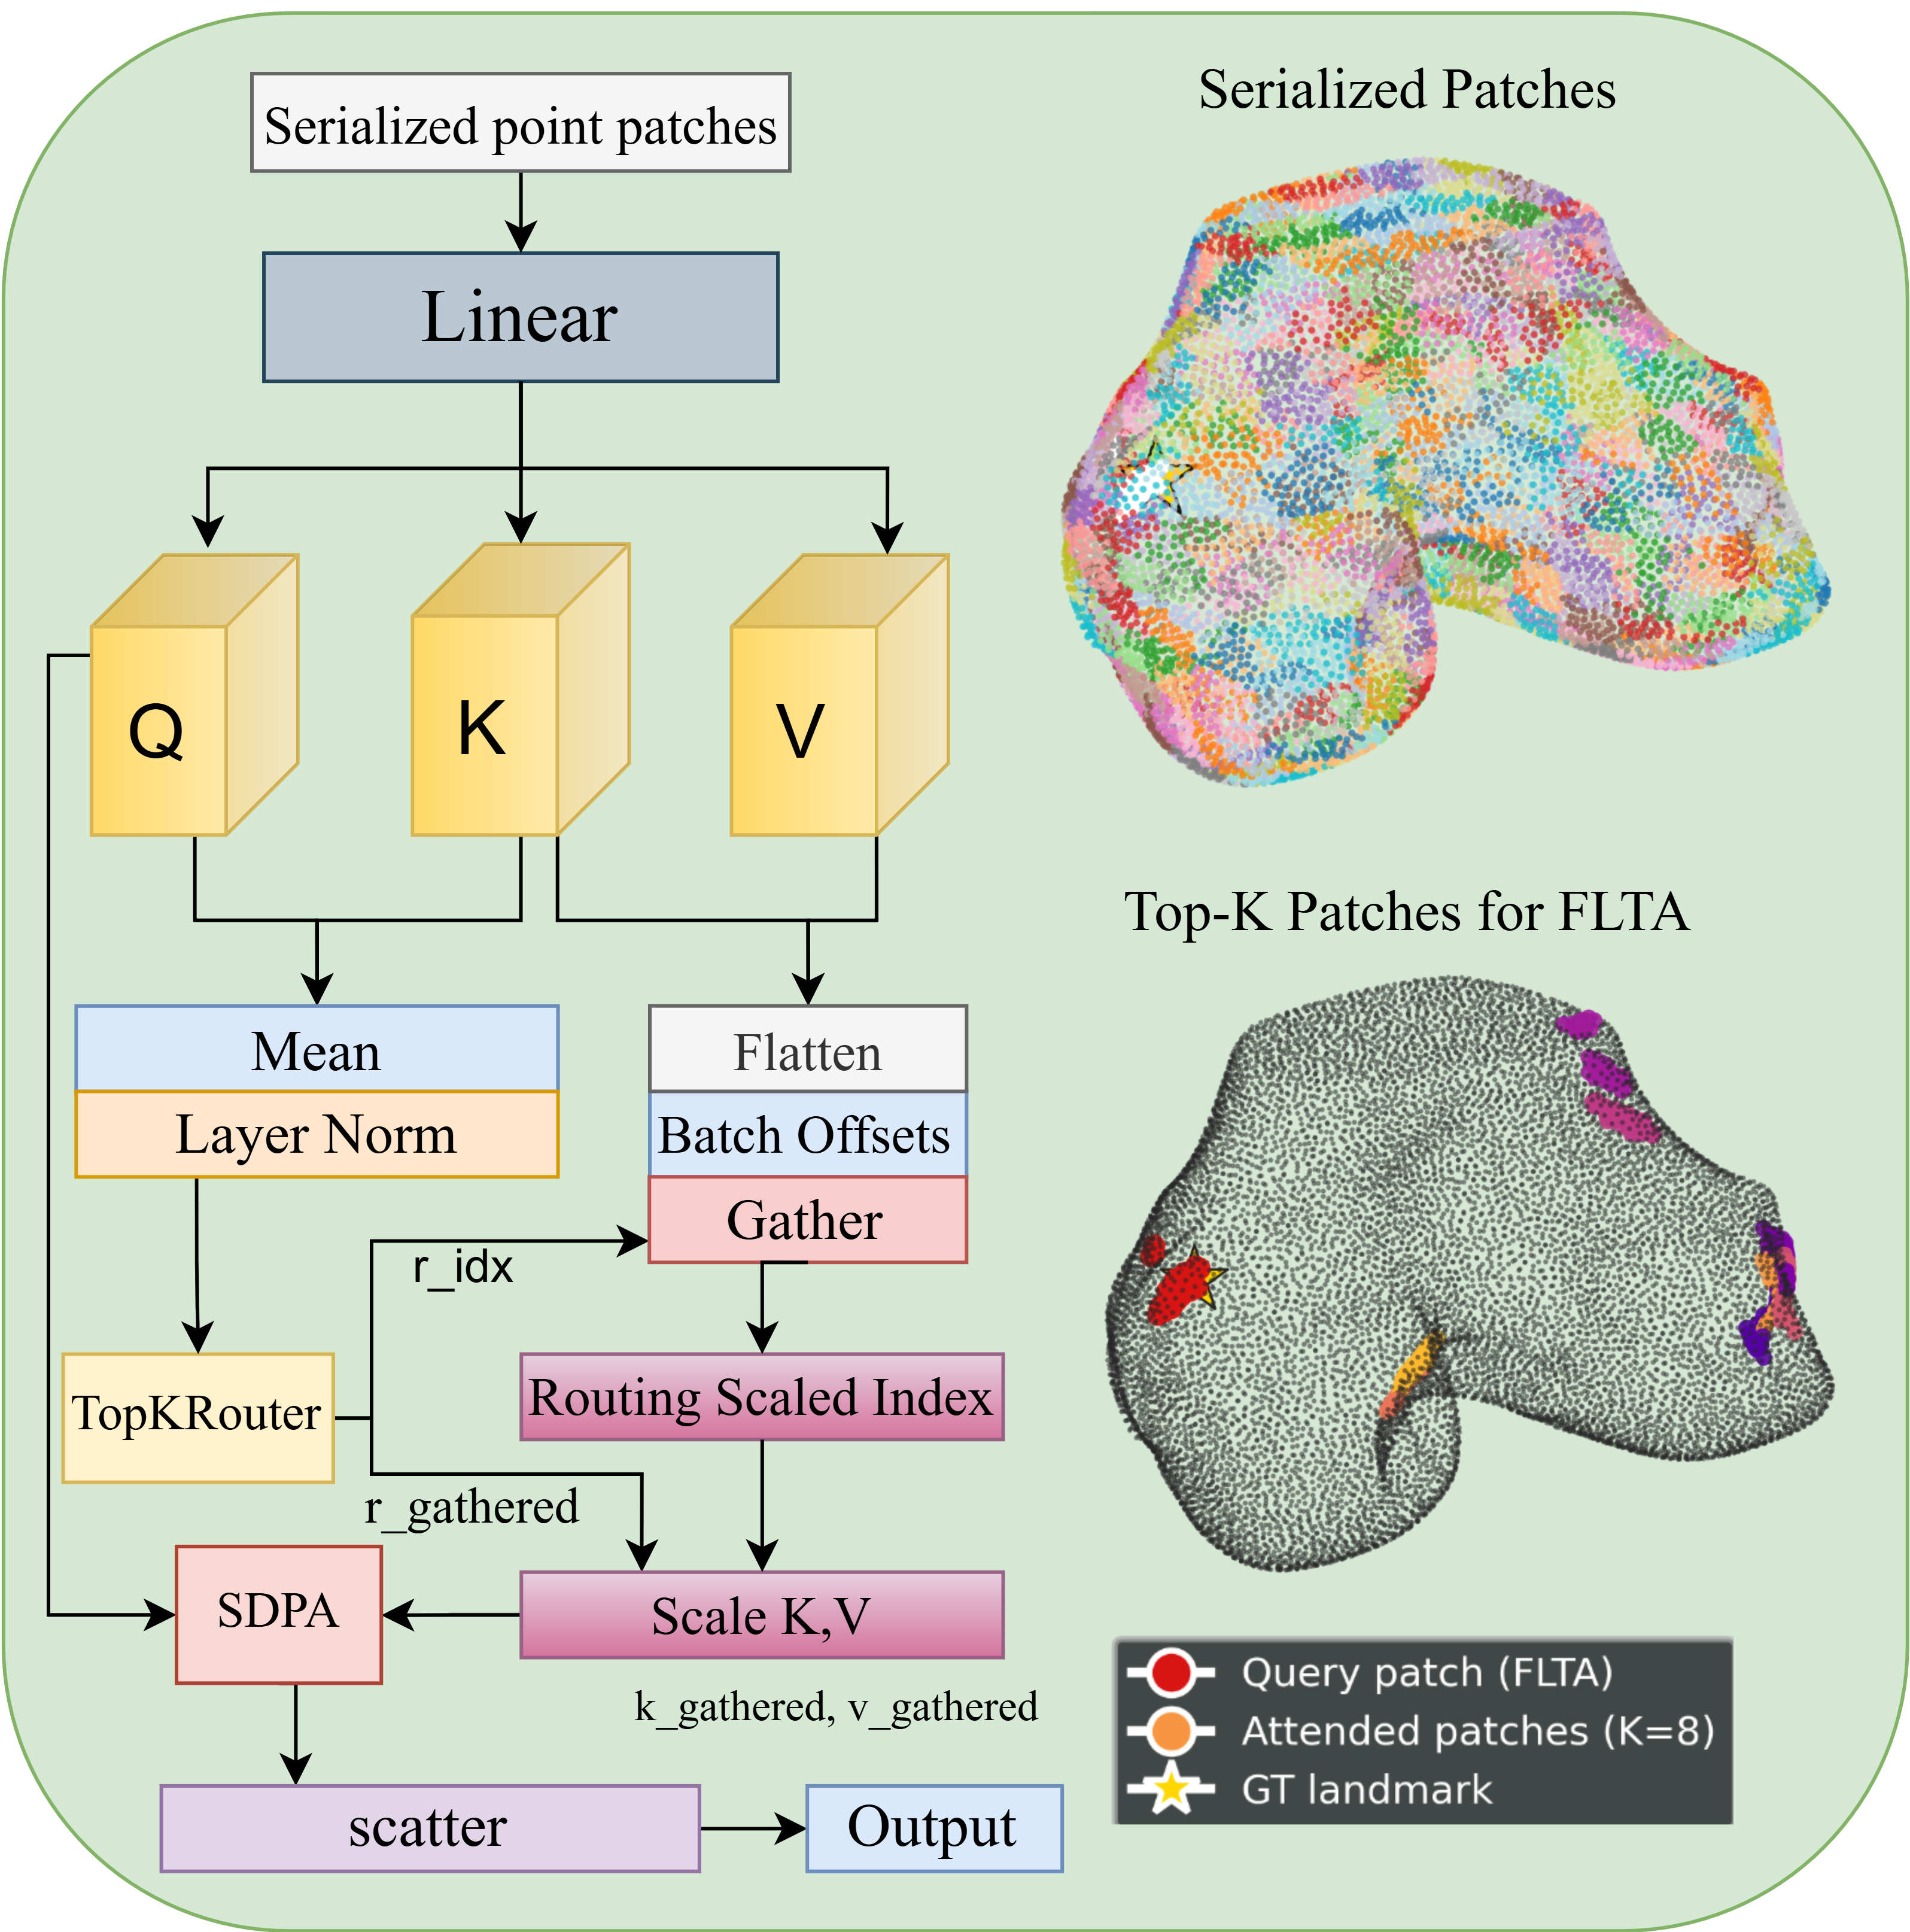
Points are serialised along a Hilbert curve and grouped into regions. A TopkRouter compares pooled region-level queries and keys to restrict fine-grained attention to only the top-k most relevant regions, cutting attention cost from quadratic to roughly linear in the number of points.
The primary heatmap regression objective. Adaptive Wing loss reshapes the penalty near the ground-truth peak so foreground pixels are weighted more heavily than the (much larger) background, which stabilises Gaussian heatmap regression.
A 3D, surface-aware reformulation of STAR loss. Predicted covariance is projected onto the local tangent plane and decomposed to separate normal from tangential uncertainty, letting the model tolerate ambiguity along anisotropic ridges (e.g. FLTA) while still penalising error perpendicular to the surface.
Each of the 11 landmarks gets its own learnable Gaussian spread rather than a fixed isotropic value, letting sharply localised landmarks and diffusely defined ones (like the trochlear ridge) converge on different heatmap shapes.
A two-level homoscedastic uncertainty scheme balances per-landmark AWing terms against each other, and separately balances the combined AWing objective against PointSTAR — so neither loss family dominates gradient updates by accident.
RESULTS
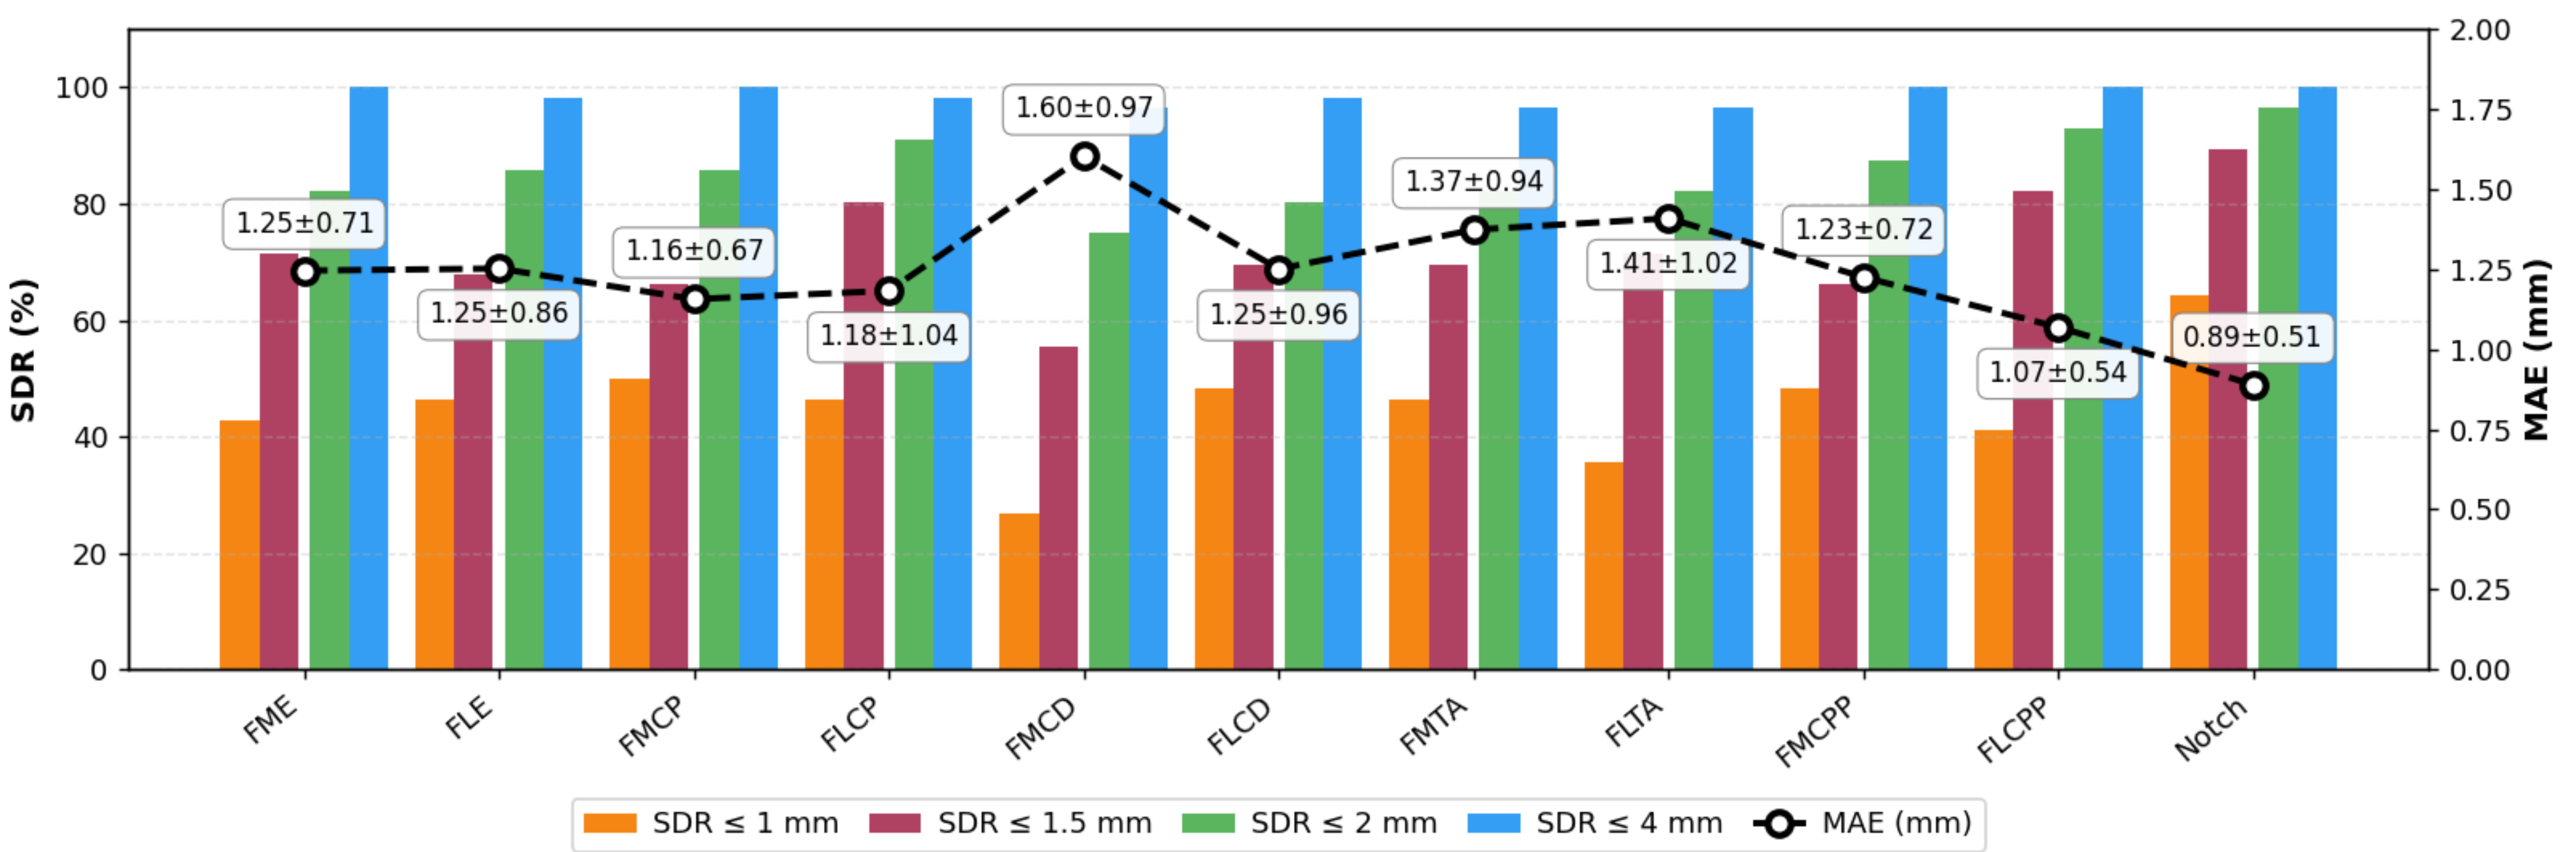
Evaluated on a held-out clinical test set against inter- and intra-annotator variability of 1.24±1.05 mm and 1.18±0.90 mm, the full model reaches an MEE of 1.24 ± 0.84 mm — matching expert-level annotator agreement — while requiring only 1 GB of VRAM and ~1.7 s median inference latency per scan.
| Configuration | MEE ± SD (mm) | Med. | SDR@1.0 | SDR@2.0 | SDR@4.0 |
|---|---|---|---|---|---|
| Base (LR-AGConv) | 1.28 ± 0.90 | 1.06 | 46.9 | 83.6 | 98.0 |
| Base + BRPA | 1.27 ± 0.89 | 1.08 | 47.5 | 85.7 | 98.7 |
| Base + PointSTAR | 1.26 ± 0.84 | 1.07 | 46.8 | 86.3 | 98.5 |
| w/o Learnable σ | 1.28 ± 0.92 | 1.08 | 46.8 | 84.0 | 97.9 |
| Ours (full model) | 1.24 ± 0.84 | 1.05 | 48.9 | 85.6 | 98.7 |
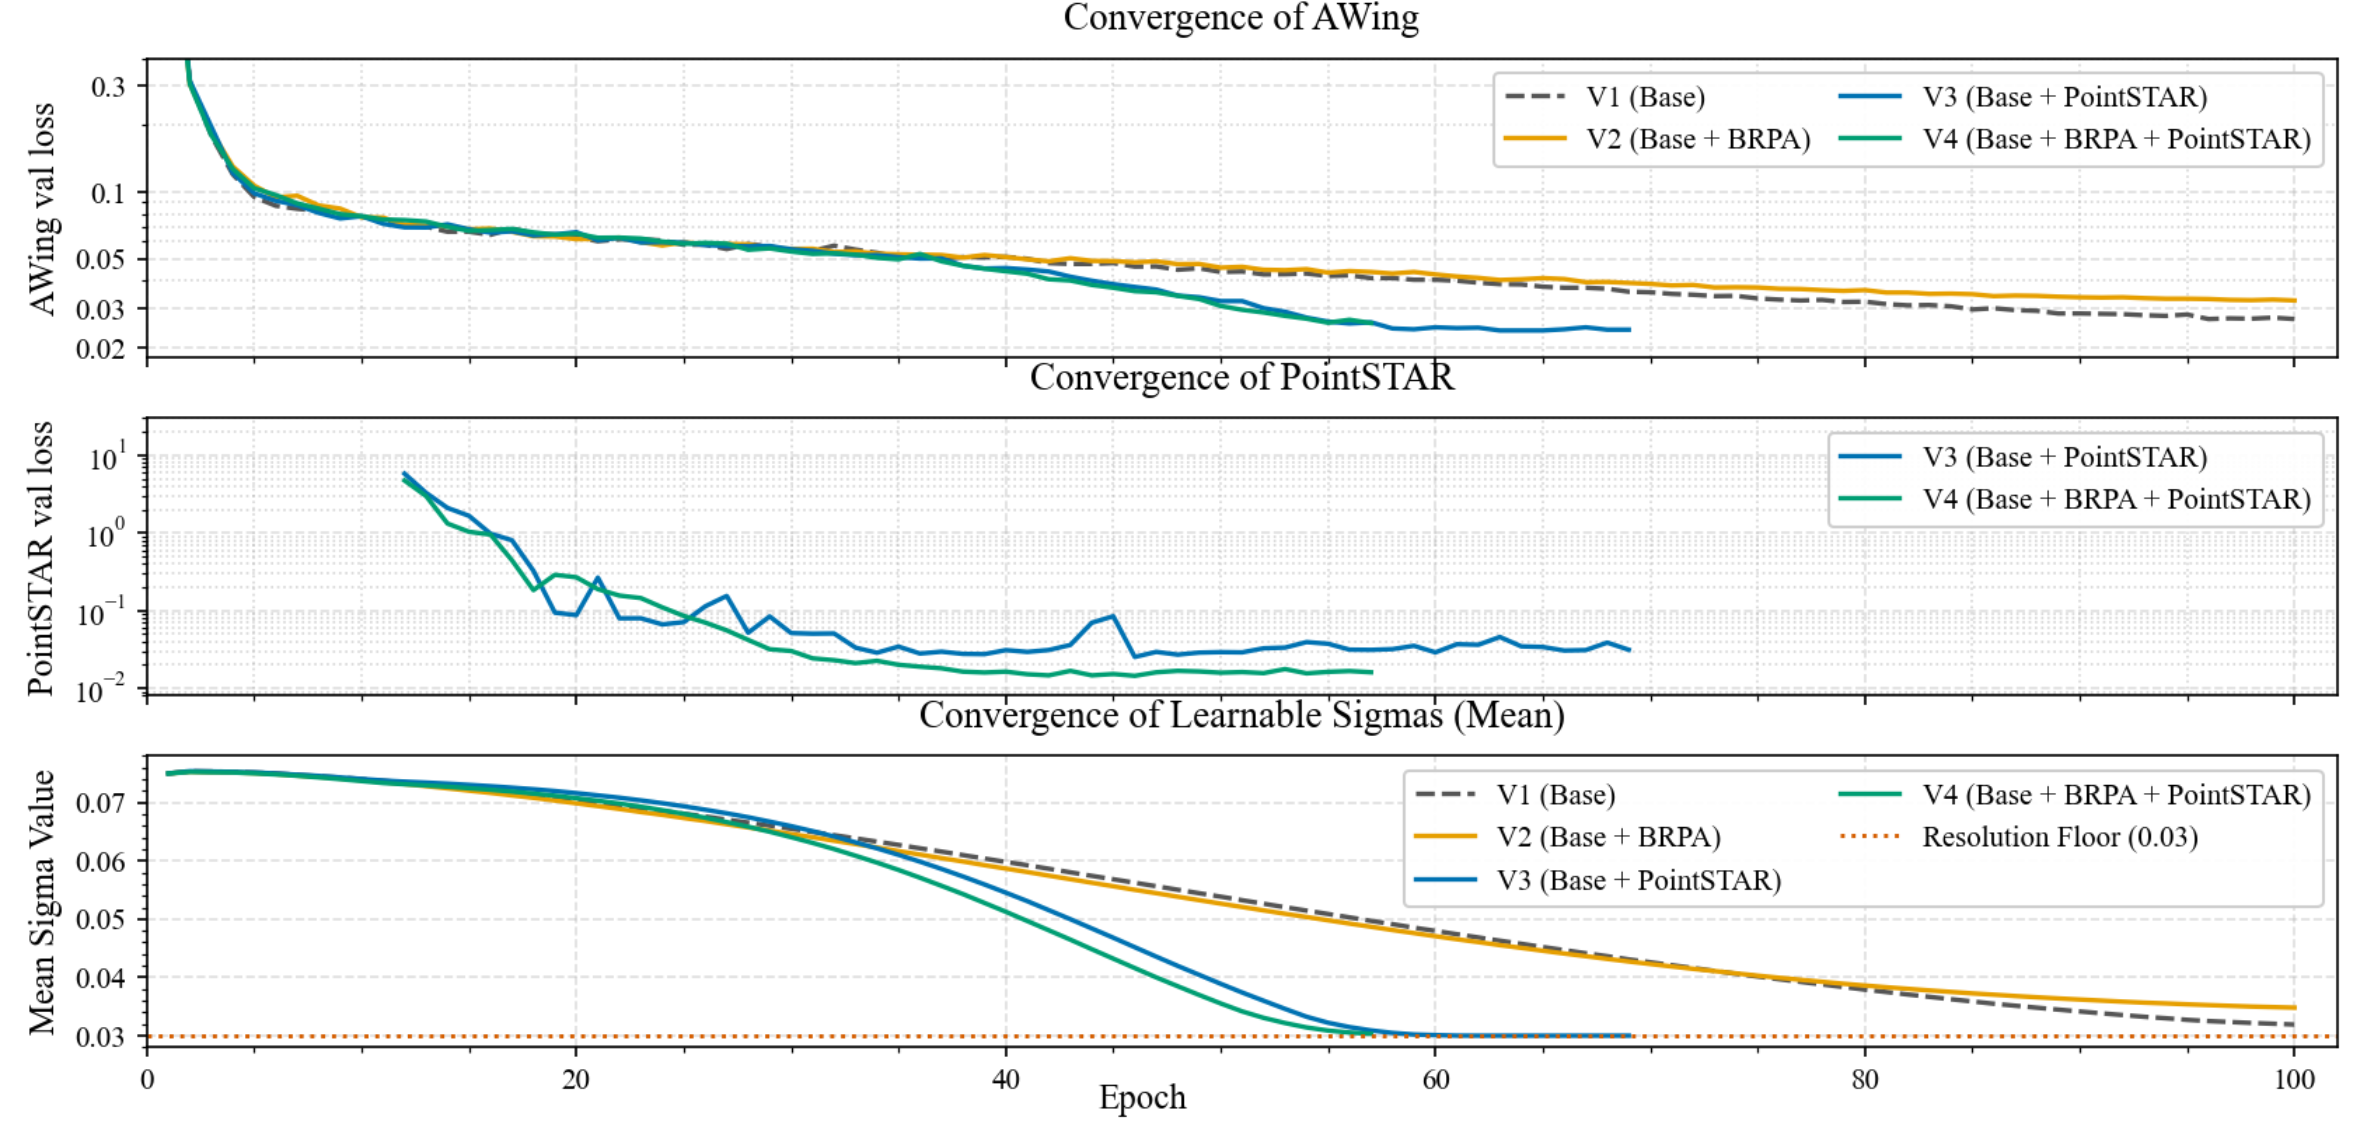
BRPA visibly smooths PointSTAR's convergence and, together with the learnable landmark-specific sigmas, lets the full model reach a stable optimum in around 60 epochs rather than the 100+ epochs needed without PointSTAR.